

REPORTING, ANALYTICS & POWER BI
Reporting, Analytics & Power BI for Business Central
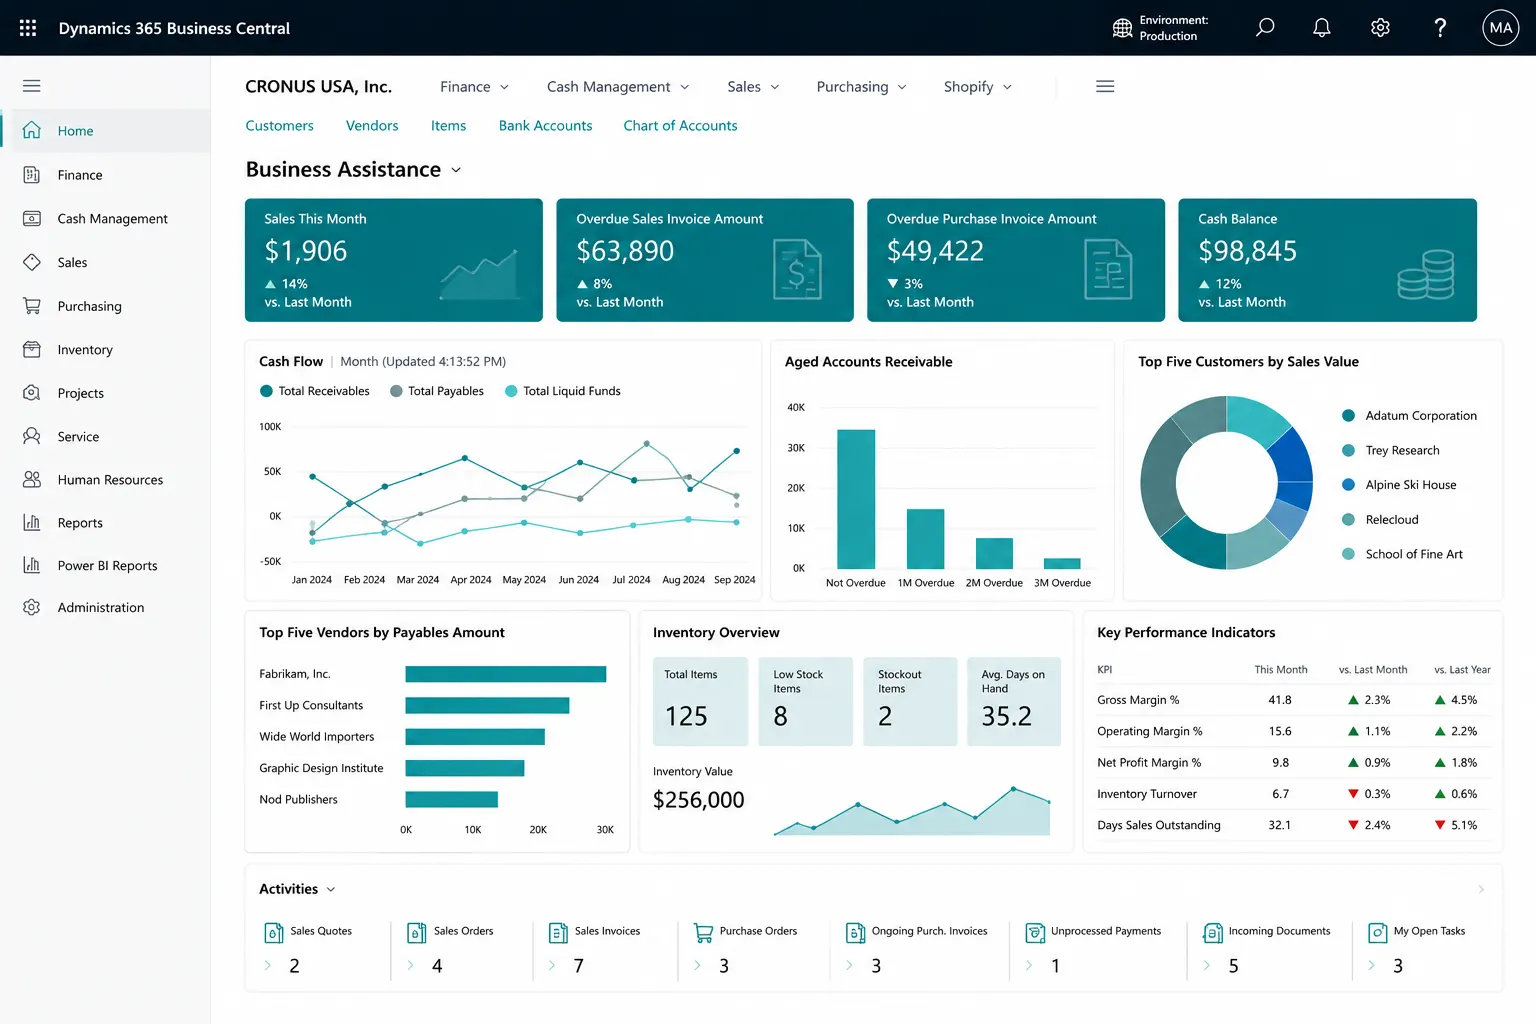
Turn Business Central data into usable finance and operational reporting through built-in reports, analysis mode, Excel and Power BI—with clear data definitions and ownership.
PROCESS & FIT
Start with Decisions and Data Definitions, Not Dashboards
Reporting should begin with the business questions, measures, dimensions, data owners and refresh expectations. Use built-in Business Central reporting where it is sufficient and Power BI or custom reporting when the analysis needs go further.
- Built-in reports
- Financial reports
- Dimensions/analysis views
Common Reporting and Analytics Challenges
Disconnected processes, manual workarounds and inconsistent data can make day-to-day control harder than it needs to be. These are common signs that the current process deserves a closer look.
KPI definitions differ by department
Dimensions/master data are inconsistent
Financial reports are not aligned to management structure
Power BI models duplicate ERP logic
Users cannot trace a number back to source data
Business Central Reporting and Analytics Options
Business Central can bring these activities into a more connected working environment. The exact configuration should reflect your processes, users, controls, reporting and integration needs.
Built-in reports
Financial reports
Dimensions/analysis views
Analysis mode
Open/Edit in Excel
Power BI apps/reports
Embedded Power BI parts
APIs/OData for custom reporting
Report layouts
Data governance
Reporting Tools Have Different Jobs
Business Central reports are best for operational/financial outputs; analysis mode supports ad-hoc exploration; Excel supports controlled analysis/edit scenarios; Power BI supports richer visual/combined analytics. Cross-system data, high-volume models or enterprise semantic layers may require a broader BI/data architecture and separate licensing.
What Better Reporting Can Help You Achieve
The goal is clearer day-to-day control, more consistent information and better visibility of the transactions and exceptions that matter to your team.
Trusted definitions
Financial statements
Operational exception reports
Ad-hoc analysis
Excel workflows
Power BI dashboards
Drill-through/source traceability
Refresh/security governance
Reporting Assessment
Where Standard Business Central Reporting Can Fit Well
Decisions/KPIs • Dimensions • Companies • Data sources • Standard reports • Excel needs • Power BI users/licensing • Refresh • Security • Cross-system data • Ownership.
Reporting and Data Requirements to Review
Business Central reports are best for operational/financial outputs; analysis mode supports ad-hoc exploration; Excel supports controlled analysis/edit scenarios; Power BI supports richer visual/combined analytics. Cross-system data, high-volume models or enterprise semantic layers may require a broader BI/data architecture and separate licensing.
Why Leaforge for Business Central Reporting
Leaforge starts with the decisions and measures your teams need, then uses Business Central reports, analysis mode, Excel and Power BI in the right places with clear definitions, ownership and security.
Frequently Asked Questions
Here are answers to common questions about Business Central reporting, analytics and Power BI. The right approach can vary depending on your processes, data, licensing and integration requirements.
What reports are built into Business Central?
Business Central includes operational reports, financial reports, list analysis and other standard reporting tools across the application. The exact set you use depends on the process and decisions your teams need to support.
What is analysis mode?
Analysis mode lets users explore list or query data interactively inside Business Central by filtering, grouping and summarizing information without changing the underlying transactions.
Can users edit data in Excel?
For supported pages and permissions, Edit in Excel can allow users to make changes in Excel and publish those changes back to Business Central. Open in Excel can also be used for analysis without publishing changes.
Can Power BI use Business Central data?
Yes. Power BI can connect to Business Central data for richer dashboards and analysis, with security, refresh, data-model design and licensing planned for the intended audience.
Can Power BI reports be embedded?
Supported Power BI content can be surfaced inside Business Central so users can view relevant analytics alongside operational work.
Is Power BI licensing separate?
It can be. The required Power BI licenses depend on how reports are published, shared and consumed, so licensing should be confirmed for the final reporting model.
How should multi-company reporting be designed?
Start with the companies, dimensions, currencies, consolidation rules and KPIs that must be compared. Depending on scale, reporting can use Business Central, Power BI or a broader data model that combines the companies consistently.
When is a data warehouse needed?
A data warehouse or broader data platform becomes more useful when reporting combines several systems, very large history, complex transformations, enterprise-wide semantic models or governance requirements beyond a direct Business Central/Power BI design.
Create Business Central Reporting Your Teams Can Trust
Share the decisions, KPIs and reports that matter, where data comes from and who uses it. We can help choose the right mix of Business Central reporting, Excel and Power BI.